| Percent of individuals | Average amount | |
|---|---|---|
| Benefits | ||
| All government transfers | 82.4 | $9,023 |
| Employment Insurance | 8.9 | $7,866 |
| Workers' compensation | 2.2 | $9,786 |
| Canada/Quebec Pension Plan | 25.4 | $8,299 |
| Contributions | ||
| Employment Insurance | 59.4 | $644 |
| Canada/Quebec Pension Plan | 59.8 | $2,439 |
| Source: Canadian Income Survey (2022). Individuals aged 15 and older; average amount in 2022 dollars among those receiving or contributing. EI includes regular, maternity, parental, and sickness benefits; C/QPP includes retirement, disability, and survivor benefits. | ||
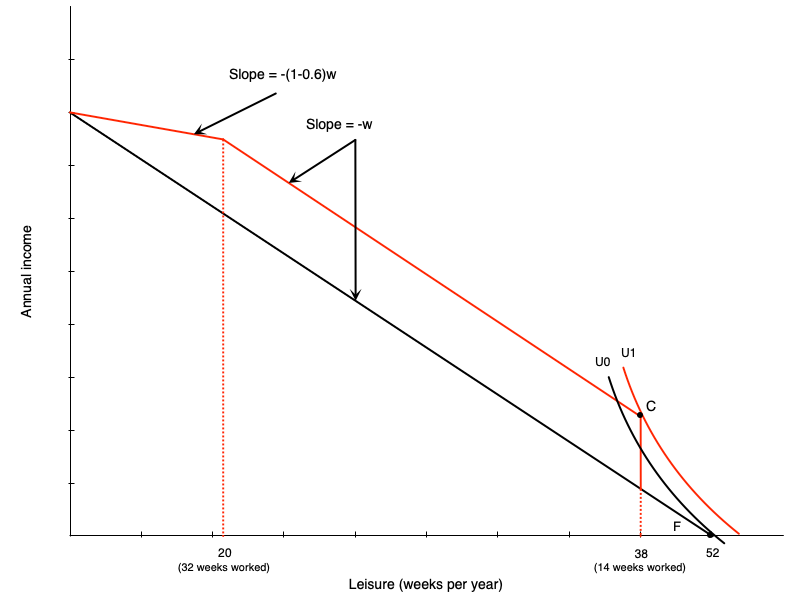
Maine vs. New Brunswick: Results
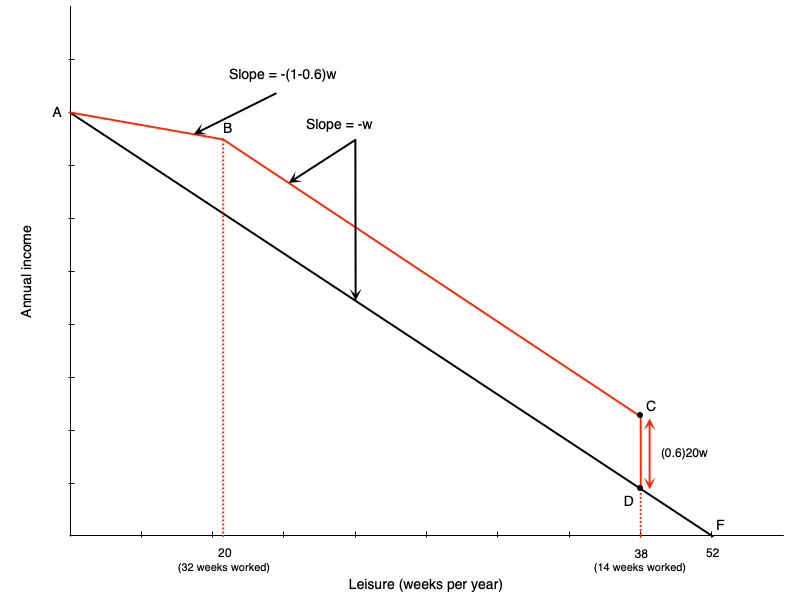
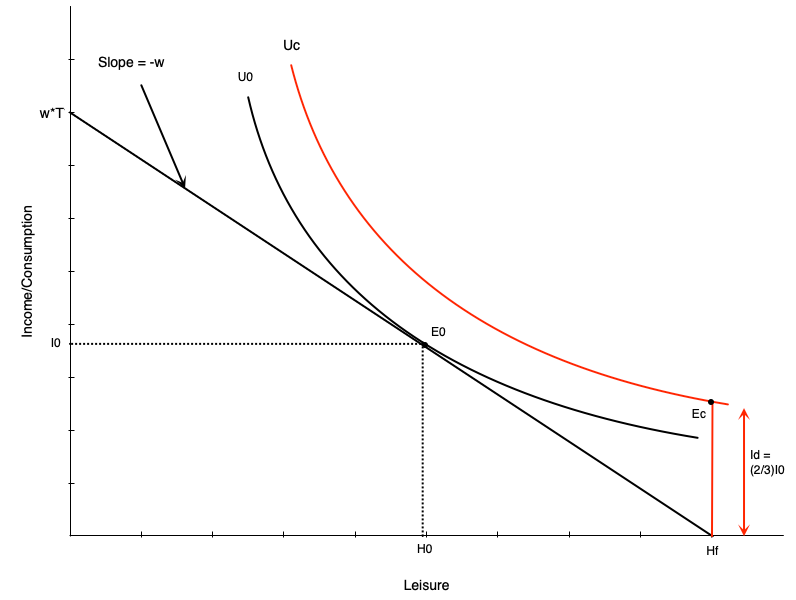
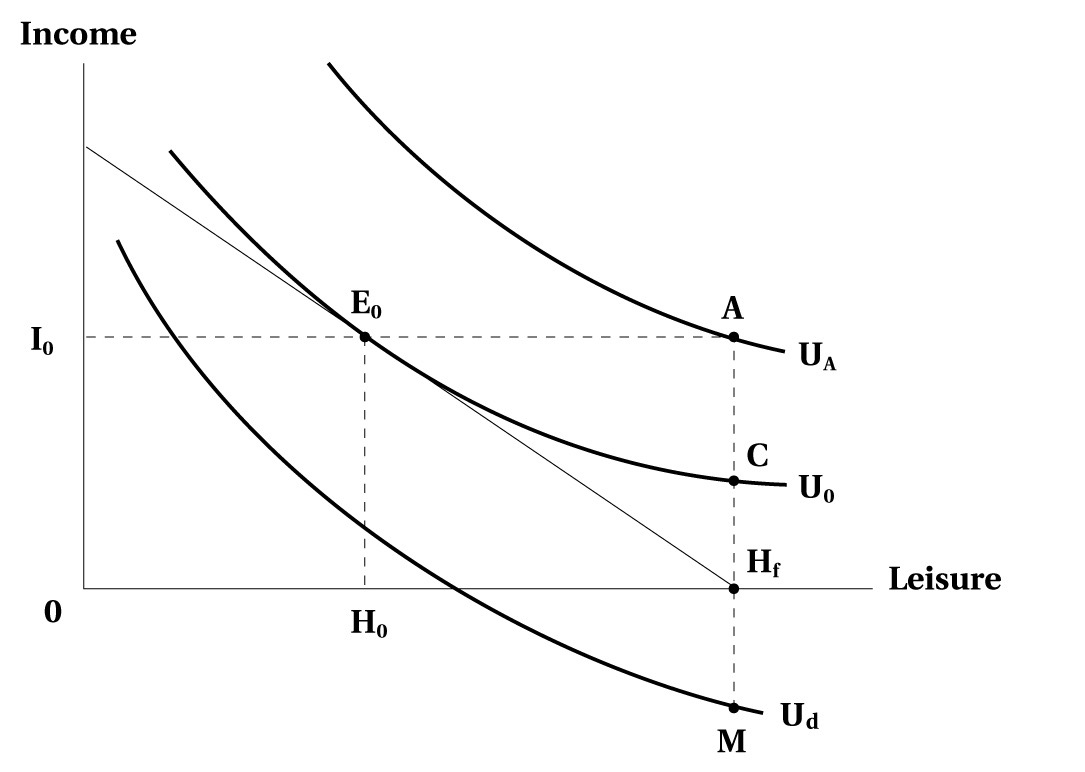
Weakly attached workers:
- More participation, and more part-year work
- The F → C move from the diagram
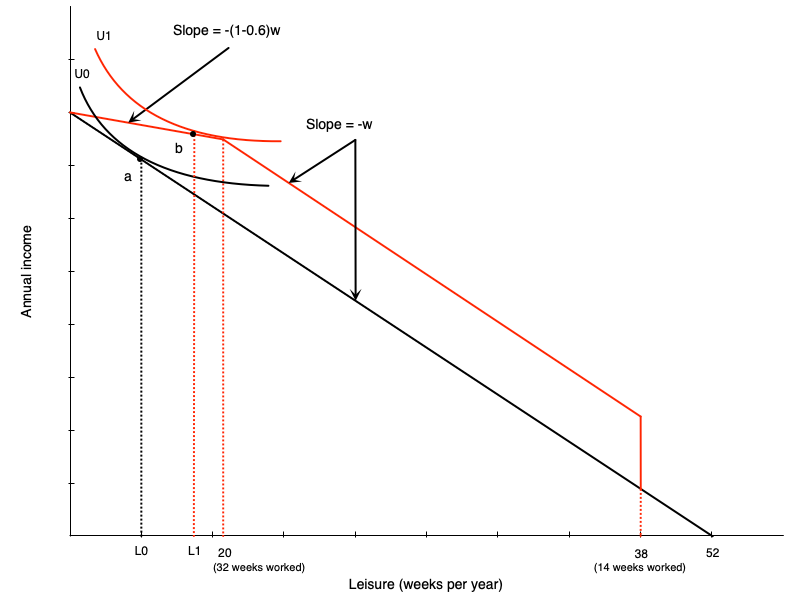
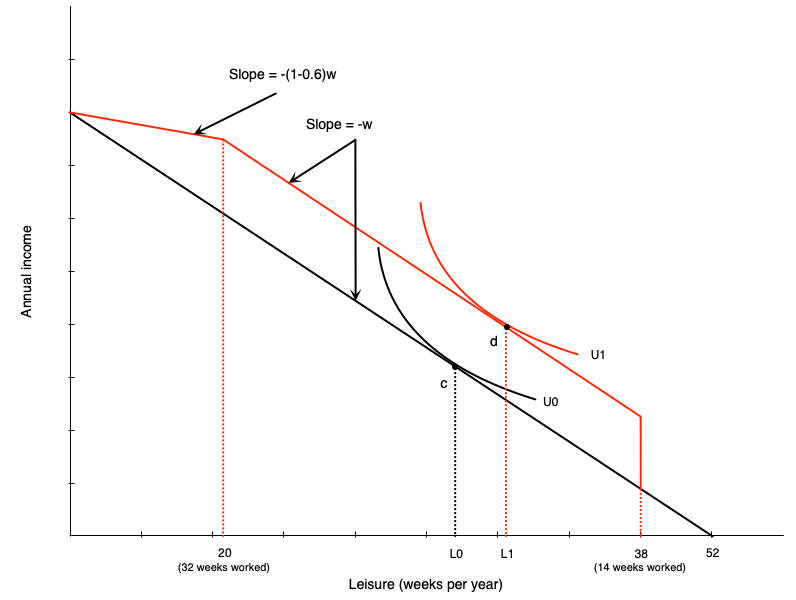
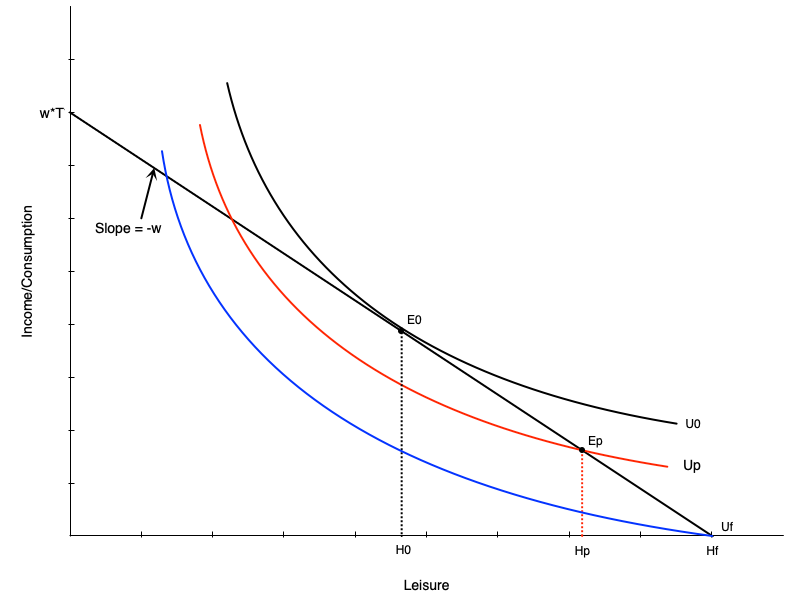
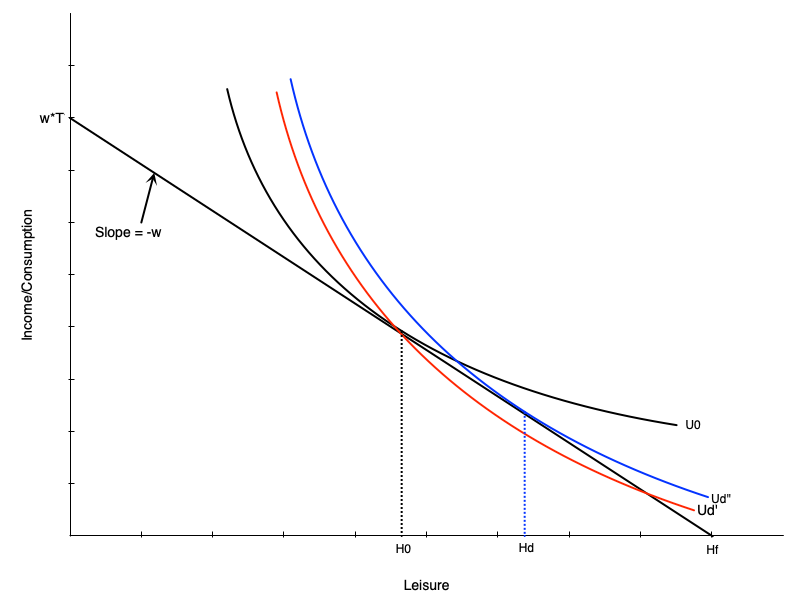
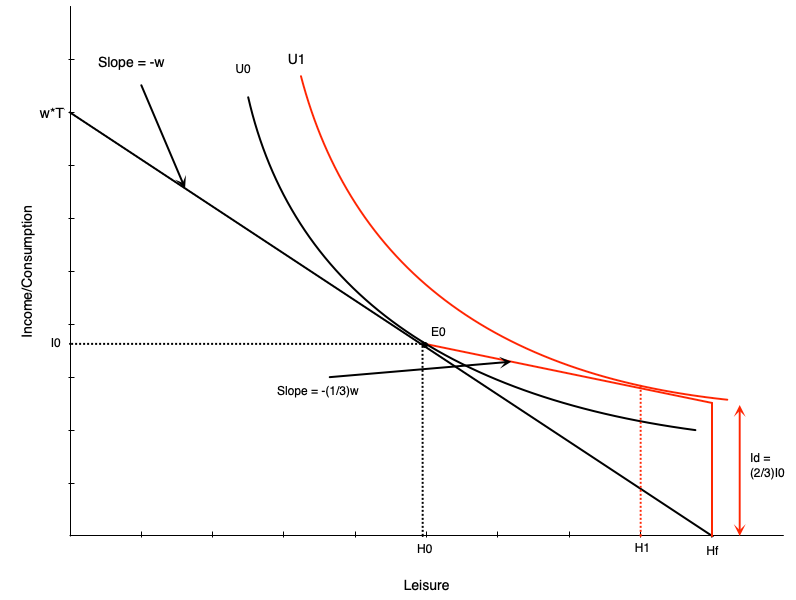
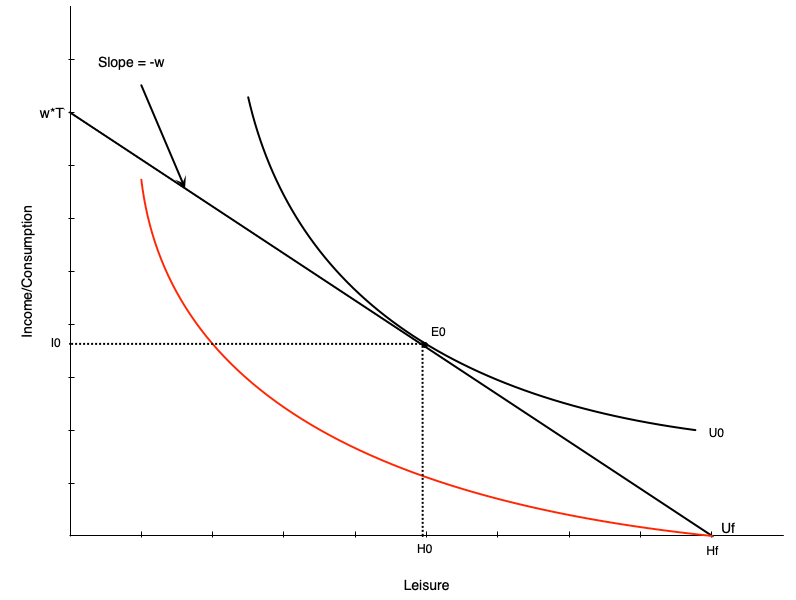
Strongly attached workers:
- Less work, and more part-year work
- The a → b and c → d moves
By 1990:
- Part-year work among working-age men: 13% in northern Maine, 26% in New Brunswick
- More than 75% of that gap comes from New Brunswick’s more generous UI
- New Brunswick’s unemployment rate rose substantially as a result
Key Result
Both responses the model predicts show up in the data
Social Insurance Programs in Canada